Freedom House does a great of job collecting data on the state of freedom around the world. In my day job, I use their Freedom of the Press (FOTP) data to understand the environment for independent media in the countries where we invest.
The only issue is that the FOTP data is only available in as wide Excel file. In this post I’ll describe how to download and manipulate the raw data into a tidy long file file, which can be easily analyzed or merged with other data. If you don’t care about the process, you can download the cleaned data here.
Downloading the Raw Data
To get the data into R, we’ll use the downloader library to grab the
file from Freedom House’s website and the readxl library to import
the .xlsx file.
library(downloader) # makes downloading from https easy

#download the raw file from Freedom House's website into the current working directory
download("https://freedomhouse.org/sites/default/files/FOTP2015%20Detailed%20Data%20and%20Subscores%201980-2015.xlsx", dest="fh_raw.xlsx", mode = "wb")

library(readxl) # dealing with excel files
library(dplyr) # the data manipulation machete

 # read in the contents of the "Global" sheet
fh_raw <- read_excel("fh_raw.xlsx", sheet = "Global", na = "N/A", skip = 4) %>%
   # select the chunk we need
  .[c(1:210), c(1,103:172)] %>%
  data.frame()

 # add a variable name  for the first column
names(fh_raw)[1] <- "country"
Reshaping the Wide Data Frame
This raw file has one column for country and then columns to the right for each score-year combo. To make these data easier to use, we need to convert it into a long
format where each combination of country, year and scores has its own
row. To do this we’ll use reshape2::melt to first melt the wide file
down to a long file and tidyr::gather to gather the scores for each
country-year combo.
library(tidyr)
library(reshape2)

fh_clean <- melt(fh_raw, id.vars = c("country")) %>%
   # add variables for the year collected and the year reported
  mutate(year.collected = rep(c(2001:2014), each = 5*210),
         year.reported = year.collected + 1) %>%
  rename(metric = variable, result = value) %>%
   # delete the extra info from the variable names using gsub
  mutate(metric = tolower(gsub("\\..*", "", metric))) %>%
   # and finally spread it back out
  spread(metric, result) %>%
   # convert the
  mutate_each(funs(as.numeric), a, b, c, score)

write.csv(fh_clean, "fotp_2001_2014.csv", row.names = F)
And we’re done. The code in available on Github and you can download the full data here.
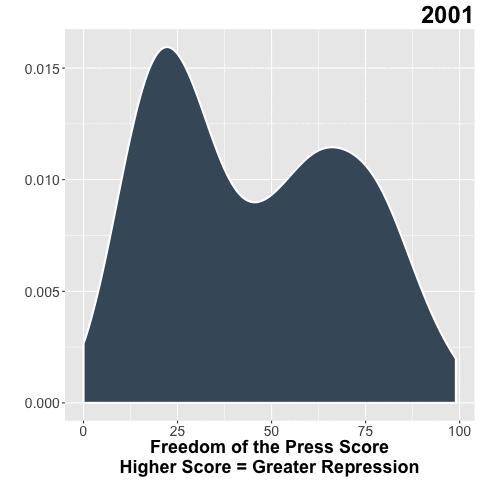
Bonus Gif!